Indicator Dashboard
Local Indicator Dashboard
Default Indicators
Starting in March 2022, OSCAR 19 provides a number of Dashboards with curated indicator templates. Thanks to OSCAR BC for permission to include the ones they commissioned which form the basis for a goodly number of them. If you have the BC ones already loaded of any vintage they will be automatically updated by the DEB to the latest versions tweaked for OSCAR 19 and your province/country.
Included Dashboards include
- A. Panel – this includes indicators about patient activity, when last seen or billed, age and sex distribution, if their contact details are complete etc.
- B. Lifestyle – this includes Obesity Smoking Alcohol Drugs and Chronic Pain
- C. Preventions – this includes Breast Screening and Colorectal Cancer Screening
- D. Geriatrics – this includes Medication Count, Advanced Care Planning, and Frailty
- E. Mental Health – this includes Depression and Anxiety
- F. Diabetes – includes search tools that allow you to bulk set your Disease Registry based on billings A1C and Medications
- G. Cardiovascular – Hypertension , CVD, IHD and patients with overdue Diabetes Obesity screen Lipid profiles and BP’s
- H. Rheumatology – Those immunosupressed or with OA
- I. Respiratory – includes search tools that allow you to bulk set your Disease Registry based on billings
- J. GI – Just chronic liver disease with the usual tools
- K. Renal – includes CKD categorization
Using the Indicator Templates

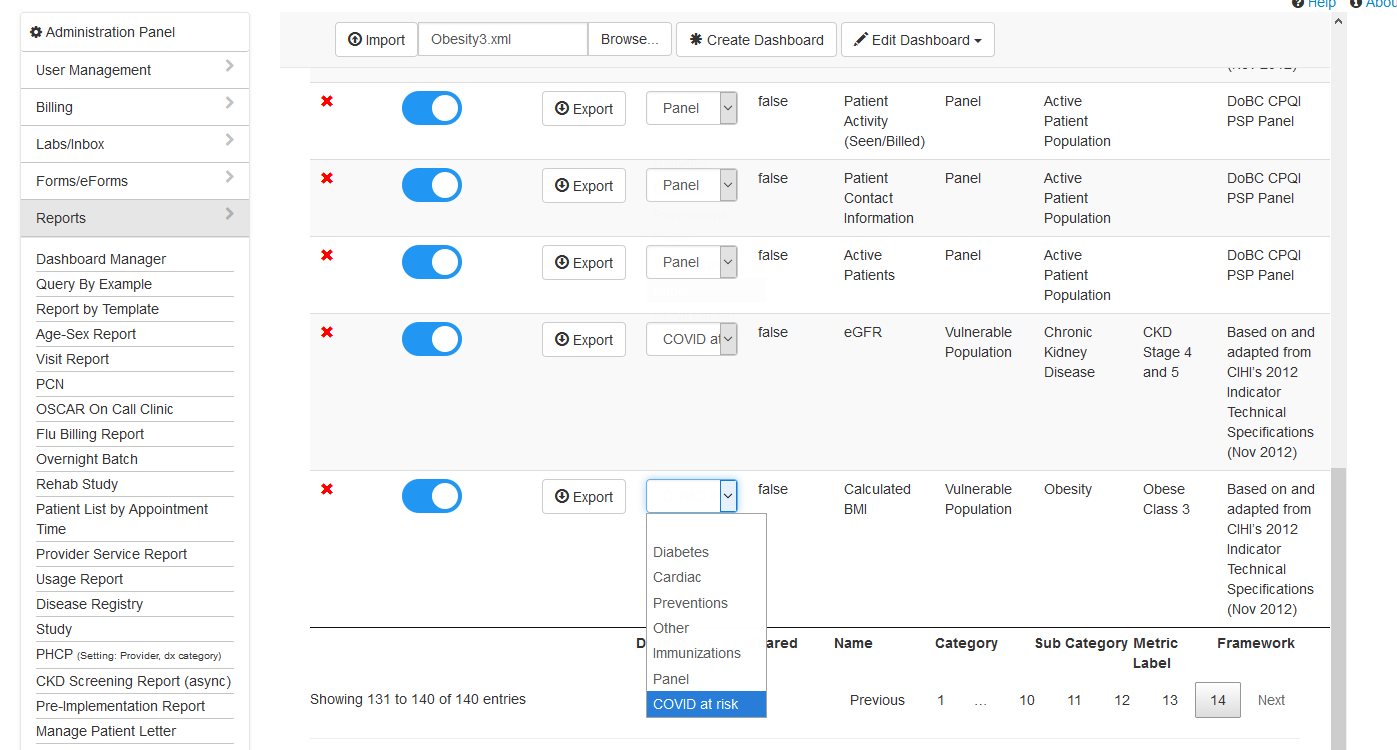
The portion of the “Panel” dashboard shown contains three indicators. The first displays a bar graph of active patients. The second shows patient how complete the patients contact information is for having both a phone and email lised. The third shows percentages of active patients seen within certain intervals.
Drill down
Each indicator will have Drill Down as an option to review the demographics relating to the information shown in the graph.
Here in the Patient Contact Information drilldown the first row shows that Ms Abracadabra is missing email data. Click on the link (14) to go to the master demographic in question to update.
Use the Action dropdown for one of a number of Actions for checked demographic(s).

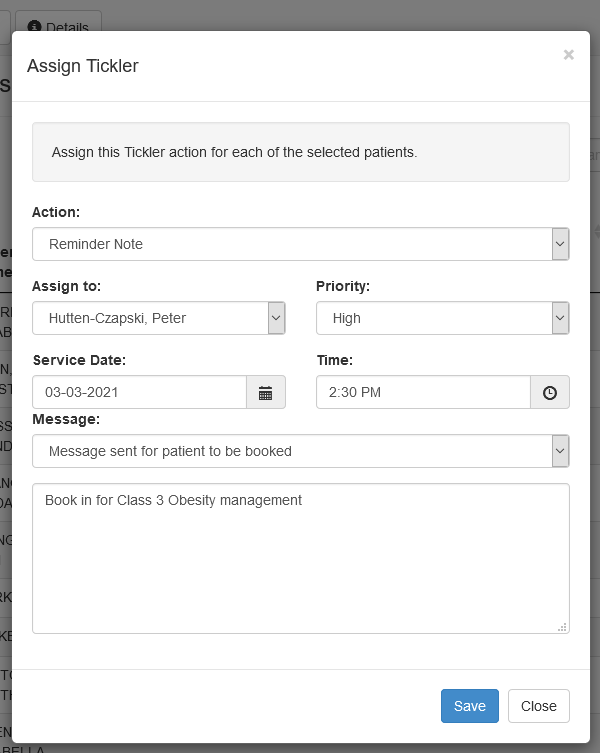
Most templates will allow you to bulk set ticklers to checked patients
Other possible actions include bulk updates to the disease registry.
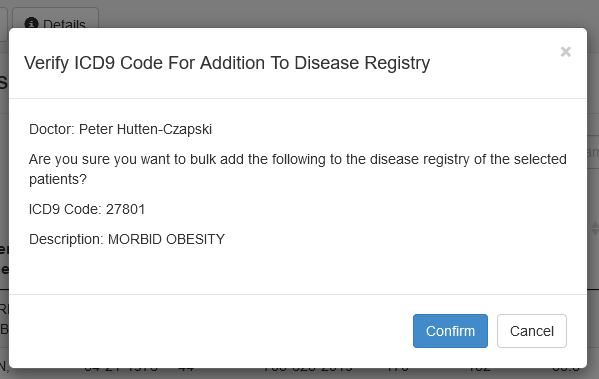
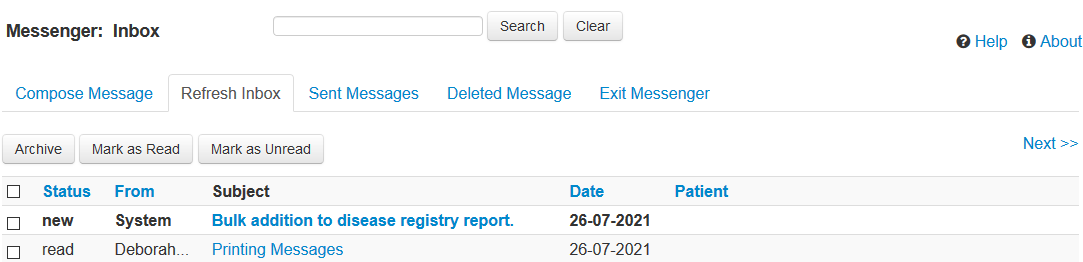
The code selected by the indicator and its common language equivalent are shown. If you confirm then each checked demographics disease registry entry will be updated with the diagnosis (if not already present) and a list of the demographics involved will be sent to your inbox.
ADVANCED: Installing Indicators
Indicators are special XML files that can be sourced and uploaded in a number of different ways. An indicator can be uploaded manually from Administration > Reports > Dashboard Manager > ↑ Import
Indicators are available here on the worldoscar.org site!
Loading Indicators into Dashboard Groups
The indicators now need to be assigned into Dashboard groups.
-
- Administration > Reports > Dashboard Manager > *Create Dashboard
- Create a “group” of indicators under a given category eg “Cancer Screening”.

- Using the dropdown next to each indicator to assign each indicator to a given dashboard group.
The assignment occurs on close, but without confirmation
Are the Numbers Wrong? Measurement Routing
The Dashboard indicator queries use standard LOINC codes for mapping patient measurements. It may be necessary to adjust the current Measurement Mappings in OSCAR in order to ensure that the various Measurements Types are picked up by the queries. It is only necessary to map each of the LOINC codes in a 1:1 relationship. The following LOINC codes are used for the following tests
Fecal Occult Blood Test (FOBT) 58453‐2, 14563‐1, 14564‐9, 14565‐6Colorectal Cancer Screening FOBT, FOB, FIT
Hemoglobin A1c (HbA1c) 4548‐4
To keep the Dashboard standard its not recommended to alter the queries embedded in the XML files from OSCAR normal to account for how data is stored in your OSCAR instance. If you need to do so please rename the indicator to show that its not stock but a custom indicator.
REALLY ADVANCED Roll your own
Some of the functionality described above is specific to OSCAR 19 and involves additional indicator XML settings than mentioned below. You can create your own template based on the following blank which is generally compatible with OSCAR 19 as well as recent forks. See the video tutorial at https://youtu.be/ADj6Bz_gTfg
<?xml version="1.0" encoding="UTF-8"?>
<indicatorTemplateXML>
    <author>PHC</author>
    <uid></uid>
    <heading>
        <category>This is the broad category of related indicators that shows up in the blue bar eg Vulnerable Population</category>
        <subCategory>this is grey bar entry eg Chronic Kidney Disease</subCategory>
        <name>this is the per graph specific indicators name eg eGFR</name>
        <metricSetName>can be left blank</metricSetName>
        <metricLabel>can be left blank</metricLabel>
        <definition>Something useful to show up on clicking info eg Providers Population age 18 and older who have eGFR measurements by CKD Stage.</definition>
        <framework>Based on whatever you like</framework>
        <frameworkVersion>01-30-2018</frameworkVersion>
        <notes>Shows up when you click on info</notes>
    </heading>
    <indicatorQuery>
        <version>03-30-2021</version>
        <params>
            <!-- constants, the example shows what you would use for reports on adults.  You need to use ${provider} for the placeholder in your SQL -->
            <parameter id="provider" name="provider_no" value="loggedInProvider" />
            <parameter id="pstatus" name="Patient Status" value="'AC'" />
        </params>
        <range>
            <!-- numerical constraints, the example shows what you would use for reports on adults.  use ${lowerLimit.age} for the placeholder in the SQL -->
            <lowerLimit id="age" label="Min Age" name="Age" value="18" />
        </range>
        <query>
            <!-- Indicator SQL Query here.  Craft your query to result counts which will then be graphed -->
        </query>
    </indicatorQuery>
    <drillDownQuery>
        <version>03-30-2021</version>
        <params>
            <!-- constants, the example shows what you would use for reports on adults.  You need to use ${provider} for the placeholder in your SQL -->
            <parameter id="provider" name="provider_no" value="loggedInProvider" />
            <parameter id="pstatus" name="Patient Status" value="'AC'" />
        </params>
        <range>
            <!-- numerical constraints, the example shows what you would use for reports on adults.  use ${lowerLimit.age} for the placeholder in the SQL -->
            <lowerLimit id="age" label="Min Age" name="Age" value="18" />
        </range>
        <displayColumns>
             <!-- which columns will you display in the drill down.  Usually they start with the first three below -->
            <column id="demographic" name="d.demographic_no" title="Patient Id" primary="true" />
            <column id="name" name="CONCAT( d.last_name, ', ', d.first_name )" title="Patient Name" primary="false" />
            <column id="dob" name="DATE_FORMAT( CONCAT(d.year_of_birth,'-',d.month_of_birth,'-',d.date_of_birth), '%m-%d-%Y' )" title="Patient DOB (mm-dd-yyyy)" primary="false" />
        </displayColumns>
        <exportColumns>
            <!-- which columns will you allow for downloading, usually duplicate of the ones you display but can be different -->
        </exportColumns>
        <drillDownActions>
            <action id="tickler" name="Tickler"/> <!-- this allows ticklers to be set for the relevant demographics -->
            <action id="dxUpdate" name="Disease Registry Update" value="585"/> <!-- the value is the disease registry code to add -->
            <action id="patientStatusUpdate" name="Set Patient Inactive"/>
        </drillDownActions>
        <query>
            <!-- Drilldown SQL Query here Craft your query to provide values for the display and export columns-->
        </query>
    </drillDownQuery>
</indicatorTemplateXML>
FEATURE NOTES
- Pie graphs are the default but are not helpful when there are too many slices. In OSCAR v 19 support exists for a heading node of <graphType>table</graphType> and bar for bar graphs either of which are better suited in those circumstances. The inclusion of this node will break the given indicator in other OSCAR forks.
- Drill down actions can include tickler, disease registry update, patient status update and excluding patient from dataset
- An optional <order> tag can order the charts in a given subCategory
- You can set a number of identical named charts with different drilldowns. set only the main one active and depending on which pie slice is clicked a different drill down is chosen. This is dependent on a common metricSetName with differing metricLabel to indicate which query to use for which portion of the pie
- The trending feature is not fully implemented
copyright © 2012-2022 by Peter Hutten-Czapski MD under the Creative Commons Attribution-Share Alike 3.0 Unported License